
The last post stated to cover some concepts and technology used to have a “real-time” dashboard using Pentaho and on a CTools dashboard. This post will give you an overview of the solution an provide you the samples.
High level description and used tools
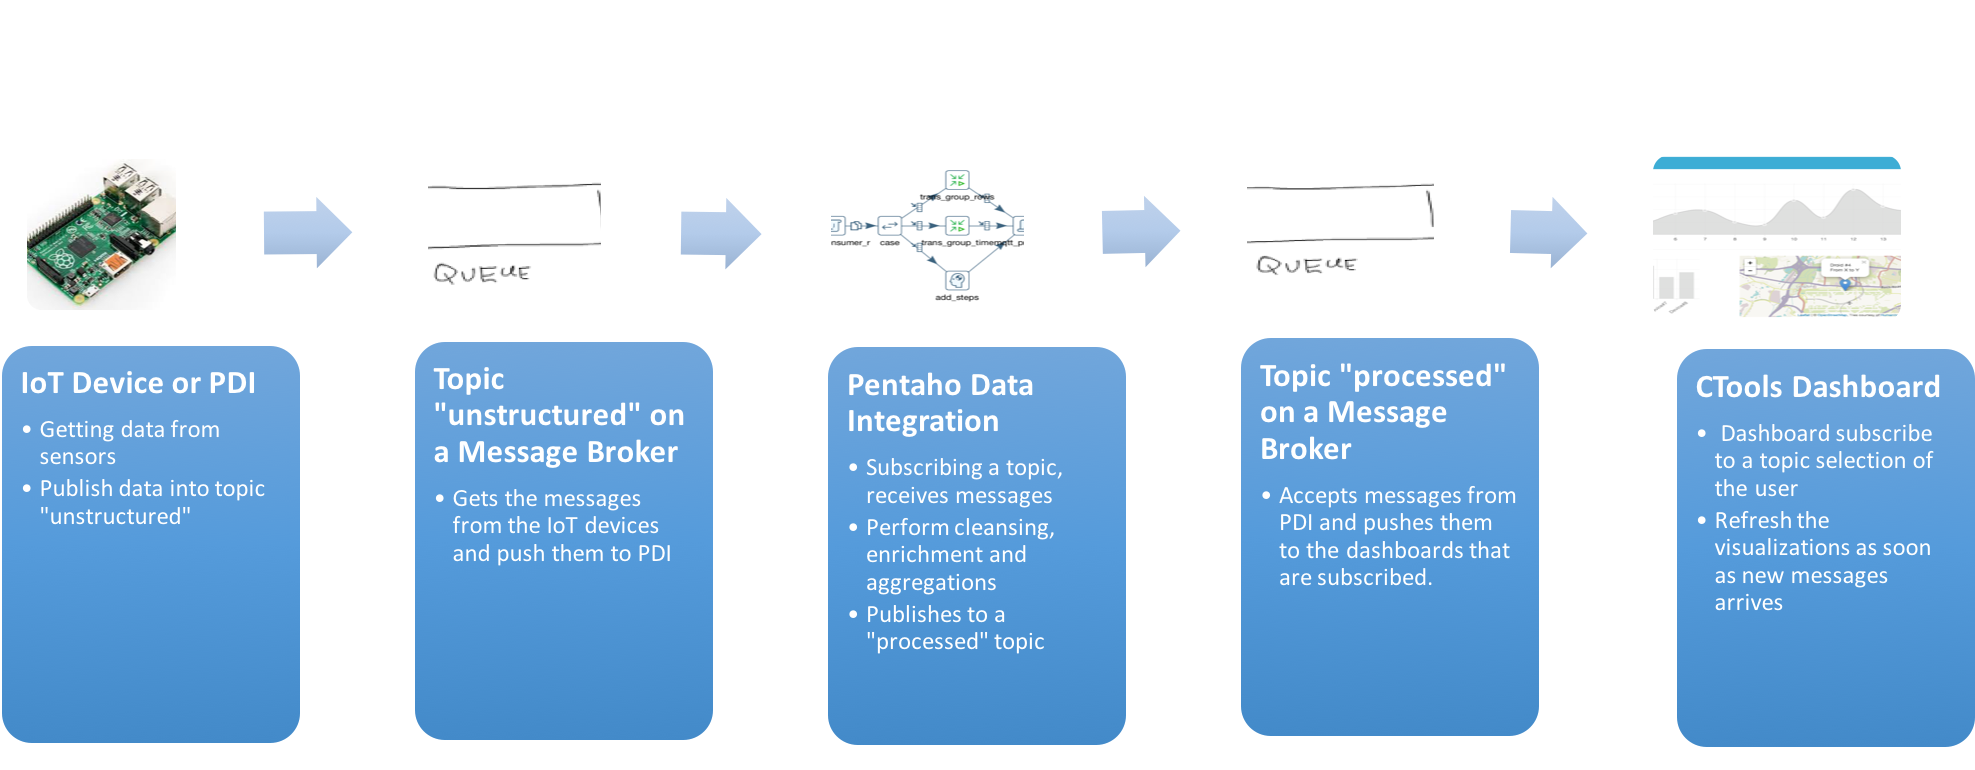
So we know that at one end we will have IoT devices and at the other end we will have the browser. So data is being generated at one end and data is being displayed at the other end. At the middle we need to process the data that is being generated before it becomes ready to be processed.
At a high level our solution is something like the folowing diagram:
The peace’s of hardware and software used on this mini POC were:
-
Raspberry PI with sensors. Here you can use a kettle transformation to generate random data. Data is being send data from sensors, using a Rapesberry Pi and MQTT. Rapesberry Pi uses MQTT to publish messages into the message broker. For you to be able to use and test the samples, I have also included a transformation that generate random messages.
-
Pentaho Data Integration and Mosquitto as the message broker. Will let’s publish and subscribe to topics. A PDI transformation is subscribed to a topic, as soon as messages are arriving, the messages are send to the PDI streaming to other steps, where we can do clean, enrich and aggregate. From there we just need to send the processed data in a message format to another topic of the message broker. Two topics were used, one that it’s just accepting data from sensors and another one that will handle the messages with the processed results. I have selected MQTT as the protocol to exchange messages, anyhow other protocols might be used. Since we don’t have MQTT steps to be used in PDI, I have written some quick code in a UDJC. There is still the need to improve the code a bit, maybe fixing some issues and develop some PDI plugins that can make use of MQTT to get data into PDI.
-
Pentaho and CTools to display live data in a dashboard. The dashboard it’s subscribing a topic, and as soon as it gets a message, it will refresh the visualizations and show data from sensors but already processed. The components used on the dashboard are not doing queries againts CDA but subscibing to a topic, so on a message arrives, the visualizations are updated accordly. The best option would be to use D3.js but to simplify your life a bit when looking to the samples I have used Charts.js. Will latter provide you the samples using D3.
Get the samples working
Samples available here.
To have the solution working you will need to install
- Install Java
- Download and install Pentaho Data Integration
- Download and install Pentaho and CTools
- Download PAHO libraries
- Run a Docker container with Mosquitto
- Upload the dashboard (and resources) to the BA Server
- Run the solution
For each one of the steps here are some instructions:
1. Install Java
You will be able to download Java from the this website. Just download the correct version of Java for your Operating System and run the installer.
2. Download and install Pentaho Data Integration
You will need to install Pentaho Data Integration making sure it is working. Don’t forget that for the Enterprise Edition you need to have the proper licenses. By the other hand if you want to use the Community Edition you can download it here.
3. Download and install Pentaho and CTools
You will be able to use the Community version available here or using the Enterprise Edition by following the instructions that are send to you when the deal is made. If using Community Edition, don’t forget to read the licenses carefully, you might be breaking the licenses agreement.
4. Download PAHO libraries
You will find in this link, the download page for the Java version. You should copy the .jar file into your Pentaho folder at a location similar to ${PENTAHO_FOLDER}/tomcat/webapps/pentaho/WEB-INF/lib/ and restart Data Integration.
5. Run a Docker container with Mosquitto
You need to have Mosquitto running, so follow the steps bellow:
docker run -d -p 1883:1883 -p 9001:9001 toke/mosquitto
6. Upload the dasboard (and resources) to the BA Server
In the samples provided here you will find two folders:
- Backend: The files needed to generate random messages emulating an IoT device, and the transformations to process the data:
- Frontend: Contains the dashboard files and all the resources that are needed to render it on the browser.
Create a Zip of the content of the frontend folder, and upload it to somewhere in the BA server repository.
7. Run the solution
From the PDI folder, you need to run the transformations, first the one to process data, by running the following command:
./pan.sh -file=${[PATH_TO_FILES}/mqtt-project-source-code/backend/iot-device-emulator.ktr -param:delaytime=200
And next, the transformation, to emulate IoT device generating data, by using the command:
./pan.sh -file=${[PATH_TO_FILES}/mqtt-IoT-poc/mqtt-project-source-code/backend/realtime-using-mqtt.ktr
Last you need to start the dashboard you will find on the folder you’ve created in the BA Server, and press the “start”
You can stop and start the IoT device emulator transformation and change the value of the parameter delaytime to be 1000. You will see that the values will be pushed slowly into the dashboard.
Follow me at Twitter