
One of the first steps when developing a IoT solution, when in the development or discovery phases starts, is to get the sensors data and send it somewhere to be processed. Depending on requirements we can go to a message centric or data centric approach.
MQTT and the message Brokers
When using a message centric approach, there are multiple protocols we can use to send messages with sensor data. In this project I have used MQTT because it’s simple, powerful, easy to use and well adopted by IoT community. As referred in MQTT.org, MQTT is “a machine-to-machine (M2M)/”Internet of Things” connectivity protocol. It was designed as an extremely lightweight publish/subscribe messaging transport”. Great part of the IoT Industry/community it’s using MQTT as the protocol to get sensor data. if we take a look to some of the protocols, this is one of the most suitable protocols to get information to one end to another. Not the only, but one of the most used for now.
For this small POC, “Live Insight Dashboard on Pentaho”, initially I have used a “Raspberry Pi” to get sensor that, and it was very easy to send it over messages to an MQTT broker. The message broker used it’s “Mosquitto”, that implements the MQTT protocol versions and provides a lightweight method of carrying out messaging using a publish/subscribe model, perfect for this POC.
You will get lots of good information about MQTT here.
As you can see there that MQTT is able to provide Quality of Service (QoS) level is an agreement between sender and receiver of a message regarding the guarantees of delivering a message. There are 3 QoS levels in MQTT:
- At most once (0)
- At least once (1)
- Exactly once (2).
From project to project, the requirements can be quite different, you may not need to receive all messages, but you may also have the need to process all data and guarantee that all messages have been delivered. So just need to set up the correct configurations. At the example provide I have used QoS equals to “0”, or “at most once”, and means that I won’t mind to lose some of the messages. Once again that will be related with the requirements.
Also, MQTT has some security options that can be used, even if in my opinion there is yet a lot to do about security.
Since I wanted to be able to share this examples, I couldn’t share my “Rapsberry Pi”, so I just created some PDI transformations that could simulate sensor data, so that anyone could get working without a “Rapsberry Pi” or other hardware besides your PC.
So in reality I was just sending sensor data from PDI to a message broker (Mosquitto) and latter process those messages again in another transformation, in order to do some basic aggregations, statistics or even windowing. Here, you can aslso use PDI and his steps to persist data in a database or whathever you need to do. Once again it depends on requirments and the goals.
To be able to send messages from PDI to the MQTT broker, I have used PAHO, that provides open-source client implementations of MQTT for many different languages. To send data to kettle, I have used some custom Java code in a UDJC (User Defined Java Class) in PDI. In the meanwhile, and based on some code that was written initially, Daniel Salgueiral already contributed with PDI steps (both consumer/producer) to be possible to work with MQTT in PDI, available here. To be honest I haven’t tested them yet, but challenge you to try them and contribute with some code to improve them, or just get feedback to Daniel.
After being processed the messages are delivered to the message broker again, but using a different topic and ready to be consumed by the dashboards or other systems that might want to use the already processed data.
The following diagram show what I was explaining above:
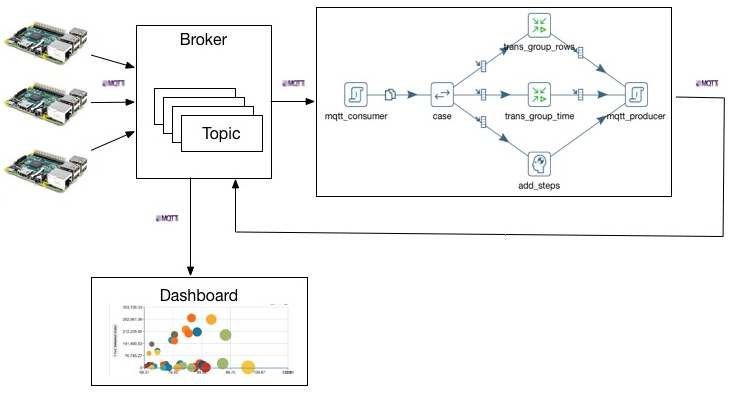
You can also see on the diagram the main transformation using 2 UDJC steps, the first and last steps, one to consume messages and the last one to work as producer, after data being processed. The remaining steps are just steps that will process data according your requirements. In my case and depending in some parameters it can perform different operations, you can even set the name of the sub-transformation to execute, so without many changes you can have this solution working as a gateway. Very useful if your system needs to scale, and useful to make use of different protocols like AMQP or even make use of Kafka, while the communication between devices and gateways is done via MQTT, or any other.
You can check the samples provided in last blog post about the subject here.
On the frontend, one interesting change of paradigm on the CTools dashboard, is that I am not doing pulls to a database, but instead, data is being pushed into to the dashboard, that refresh’s the visualizations as soon as a message arrives. But this is another story that I will cover in a new blog post, so keep an eye in the blog. Anyhow let give some info in advanced, MQTT has a client library that can be used directly on the browser and inside a CTools dashboard.
Are there any options besides MQTT? Yes, there is a lot of options as also a lot of tools to use in IoT and to produce incredible analytics, once again, it all depend on the requirements.
Follow me at Twitter