
Most people haven’t realized that there is a component named “Template Component” in CTools or just don’t know how to use it, most because they haven’t read the Book Learning Pentaho CTools. Let me give all a brief overview on how it works.
More than once I have done a project where it would be good to be able the define the elements I wanted to display on my dashboards to present the data coming from a CDA data source. The existing components are based on pre-built visualizations like a table, a line chart, a bar chart, a drop-down, but I was trying to go further than that. Doing the same code for different dashboards, I thought it was about time to create a new component that would allow us to define the HTML to use when bringing information into the dashboard. We could always use the query component to your dashboard, but much more code would be required, so when you think you don’t have the visualization you expected, don’t worry, most probably you can use the template component.
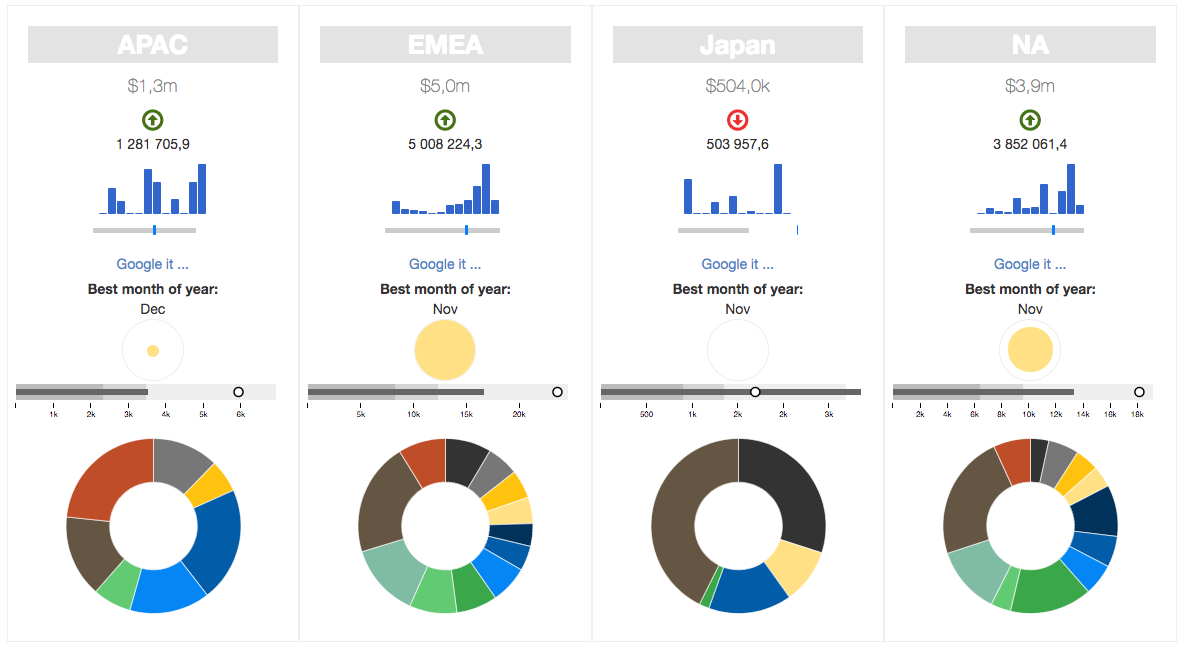
The following image is an example of using all of the out-of-the-box functionality that the components provides.
First of all, you need to understand the concept of templates. Usually there are terms associated, model and view, where you can understand the model as the data you have to be displayed and the view the way you want to have displayed. It’s not the purpose of this blog post to get into the details, but, you can find more information on the links in the next sentence. For now, there are 2 templates engines we can use: Mustache and Underscore templates.
You must select the type of template you want to use. You just need to go to the properties of the component and change the “Template Library” property. Note that the default engine is “Underscore”. In this blog post series we will use “Mustache”, so you need to change the selected engine on the component properties.
One of the best examples where to use the template component is when you have multiple elements you want to repeat, based on how many lines you got on the result of the execution of a specific query.
So, let’s keep it very simple and consider you wanted to display something like:
- APAC: $1281705.9
- EMEA: $5008224.3
- Japan: $503957.6
- NA: $3852061.4
The html in your webpage/dashboard would look like:
<ul>
  <li>EMEA: $168479</li>
  <li>APAC: $601606</li>
  <li>Japan: $168479</li>
  <li>NA: $1821247</li>
</ul>
We can see that there are elements that are repeated. The <li> html element is showed multiple time, just changing what’s inside of each element in the list.
Let’s suppose, that the result of your query is something like, where column #0 is the name of the territory and column #1 is the sales value for that territory. Just like in the following table.
| Territory | Sales     |
|-----------|-----------|
| EMEA      |  168479   |
| APAC      |  601606   |
| Japan     |  168479   |
| NA        |  1821247  |
So if using Mustache, you can build a template like:
<ul>
  {{#items}}
  <li>{{0}}: ${{1}}</li>
  {{/items}}
</ul>
The Mustache engine, will use this template and render the data using the template that is defined. So for each item or territory, it will create a <li> element with the respective name and sales value. We can see {{0}} and {{1}}, where we are referring to the result of the first and second column. By default, the template component uses the index of the column as the reference to get the value we want o display. By using the Model Handler, discussion for another post, we will see how we can change and use more friendly names.
To use the template component, just add he template component to the dashboard and set the “name”, the “datasource” and the “htmlObject”. Then, set the template by writing a small JavaScript function with the code below, that just returns the template we want to use.
function() {
  var template =  '' +
    '<ul>' +
    '{{#items}}' +
    '<li> 0: $1 </li>'+
    '{{/items}}' +
    '</ul>';
  return template;
}
This functionality, just by itself, it was not enough to me, being able to create templates but being required to build complex templates. I also wanted to make the component somehow flexible that we could use addins, just like we can do it on the table component. If you do not know what I am talking about take a look at this blog post from Pedro Alves.
Another great functionality in the template component is that it allows you to apply formatting or even event handling in a very easy way, even if you need to write some lines of JavaScript code.
The blog post would get too big if I tried to cover all these options, so I will write a couple more posts on this topic, and how to use more advanced option of the Template Component, like using the addins, or even creating your own addin.
The template component is a component that allows us to create custom visualizations based on templates and models, all based on the data that we have acquired from a data source.
The template component is a component that allows us to create custom visualizations based on templates and models, all based on the data that we have acquired from a data source.
TIP: Don’t forget that we use Twitter Bootstrap framework, so you can also use it when defining your templates.
Follow me at Twitter